I was hesitating about my previous analysis, but it seems that it worked out. Tuesday, wednesday and thursday bars were very bullish with a long wick downwards so price had a difficult time to push price lower. I'm not sure why, but 1.5140 seems to be a strong support. My trend line in the daily chart was broke through with today's bar and with a few hours of trading session remaining, I do not see any possible backwards movement.
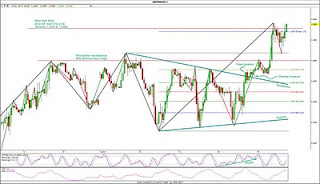
In a closer look with a hourly chart, we can see my previous analysis and a few more things around it. With a upward movement in mind, I drew some fib extensions and resistance lines. Even though, things didn't seem to go according to the analysis, I was bullish... price started to behave in a consolidation phase. Price bounced within a range in the intraday chart, but forming that long-wick bars on the daily chart.
With the range defined with those resistance and support lines, a breakout of either way could mean a big movement on price, whether up or down. If price would had broke the support line, probably price could went as low as 1.5000; but the breakout occur to the up side; first with a false breakout, but then all the way with a few closes out the channel. In the short-term analysis, my price target was around 1.5370 (1.27 fib extension) & 1.5382 (previous high), which was reached without a problem.
Did I enter the trade? No! I'm still hesitating about my own analysis. What the hell? I need to be more confident.
Which is the forecast about this cross? If I have learnt something in this life... I can say that you can't give anything for granted. Technically speaking, I don't see any near resistance on the horizon. 1.5400 could be a psychological resistance as it's a round number, then 1.5500. Previous fib retracement levels could mean some resistance, maybe 1.5421 or 1.5619. Applying fib extensions, price could reach 1.5541 (1.27 fib extension from last swing) or between 1.5626 & 1.5641 (some fib-ext of different swings)
If I start to analyze things with Elliot wave theory, all my previous analysis are trash. If we see the daily chart, price might be at the end of a corrective upward wave 4 and heading south to complete the 5-waves impulsive downward movement with a target around 1.43s.
That's something I can't overcome yet. Sometimes I think in a possible scenario with solid foundations, but an indicator or another kind of analysis just tore it down. And I don't want to start talking about multiple time frames analysis with the same problem.
Personal reminder: Keep It Simple Stupid!
.

