Weekly
Daily
Tuesday, December 7, 2010
Wednesday, November 24, 2010
Friday, November 19, 2010
Thursday, November 18, 2010
Monday, November 15, 2010
Wednesday, November 10, 2010
Tuesday, November 9, 2010
Sunday, November 7, 2010
Eurchf
Weekly
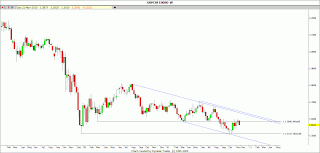
Last bar in the chart shows an outside bar which also is a bearish engulfing candle. For me this candle means a possible continuation to the downside aligning price action to the longterm downtrend. The last few swings showed similar behaviors with a steep decline every time. The other scenario would be this is a possible retracement from the current midterm uptrend. If price breaks the low of this candle, further decline could occur.
Daily
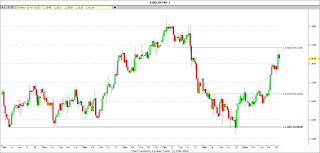
With the same regression channel in place from my last post, price has formed an inside bar. Considering a break of the high or the low of the mother candle as a sign of further direction, price broke the low and also the regression channel, suggesting further decline in price. What is really interesting of this chart right now is where price is sitting at the moment. Resistance became support and price has found trouble to pass through the previous R/S zone. The two possible scenarios: first, again comparing previous swings, price just drop sharply in similar circumstances so further decline could happen because we are still in a longterm downtrend. The second scenario for me as price has found support, more than likely, a bounce up is going to happen next. The 120sma is also providing some support.
Therefore, we may see a 2B formation or a continuation but again price action must be considered. The high and the low of the last bar of the chart will provide clues of future price direction.
4H
If we were analyzing only this timeframe, I would be more bullish than bearish. In the last swings, price has been making higher highs and higher lows suggesting that we are currently in an uptrend. Again, just looking at this chart, right now price might be presenting a long setup. Price has encountered support in a former resistance zone and has stalled, forming a bullish candle that just touched the 200sma and bounced up. This zone also coincide with the 0.382 fib ret. The last bar of the chart has made a shy higher high and a higher low from the previous one, and seems that the bears just couldn't push lower, resulting in a really small range, or in Wickoff terms, really small spread. If price do bounce up from the support zone, at least should reach the 1.3686 but if fails, 1.3265 would be the next possible target towards the south.
.
Saturday, November 6, 2010
euraud EW no more
From the last post on euraud, in the 4H chart I expected a 5 wave impulse upward movement, but with the break of the w4 low, elliot wave theory is not applicable from now on for this pair at this moment.
Weekly
Price is clearly still in downtrend. Last bar though showed a big drop. Probably we will see a retest of the down trend line of the channel in the next two bars ahead. Due the steep decline, price might stall or even bounce back to retest the up line of the channel before the continuation down.
Daily
In the daily chart we can see that price has been trading within a range. The break of the range wasn't very convincing to me due price almost returned inside, ending as a bullish candle. I decided to wait and see the next day and almost the same scenario repeated again, forming a bearish candle instead. With last's thursday close though price finally broke the support and by friday found enough momentum to push even lower. Price has stalled at the .786 fib ret from last swing. I don't think this level can hold price so, more than likely, a retest of the 1.3658 low "should" occur.
4H
In the chart below I have included the data since my last post. There are the elliot wave counts and why this would be invalid now. Price was unable to make a wave 5 within the time expected. Due the alternation law, I assume w4 would be an irregular wave but a w5 never happened.
A w5 not necessarily needs to make a higher high than w4 but should be at least close to it. Here, not even close. Price broke the w4 low for a few pips and then entered into a trading range, thus all hope for a five wave elliot pattern was vanished. Once price broke the range to the downside, and below w1 high, also confirmed that the e-wave count wasn't valid anymore.
Analyzing more recent data, in the chart below, I have circled some areas of interest around the 200sma and 120sma. By now, price has stalled around a fib cluster, so a retracement could occur next week. I'm now concentrating my efforts in analyzing price action so it hasn't much sense to forecast something without watch realtime development. Due price has dropped quite fast, a retrace should be expected, but as the last candle in the chart, there are no clues suggesting it. Price has punched through the fib cluster with no or little hesitation. Watching how price reacts to the high or low of the last bar could give some clues about next price movement. Even though I won't be surprised if next week starts with a big gap up.
.
Subscribe to:
Posts (Atom)


