Sunday, September 20, 2009

So, what happened...


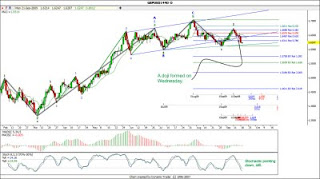
My analysis was accurate enough but I didn´t enter the trade. By now, I´m expecting gbpusd to go lower, at least to 1.6112 (1sep low), even lower.


On wed16, we had a doji and that freak me out. Stochastics were pointing down so that was a little contradictory. By that day I was considering to go short because we had the dma crossover, but with that doji there, I needed to wait to see what the market was doing. That could mean a long oportunity but, as we saw, my first analysis could give be an outstanding 400 pips if I have entered short on 1.6650 to 1.6250

Right now, on sunday night, a bullish candle is forming. That could mean that due the several bearish bars through the week, maybe traders around the world are closing their positions. We can see, maybe, a recovery in price that could reach 1.6340 or even 1.6380 or 1.6422. I´m not sure but time will tell.

From my initial analysis, price has to go down till 1.5758 at least.
.
Monday, September 14, 2009

No surprises there...


Just waiting for a develop wave three, by now is in progress... for me anyway.

I attached a DMA. One mechanical trading method says that a order signal could be trigger at the crossover. Should I wait or enter already?


The second graph is 1H gbpusd chart. Just for a glimpse about how technical analysis works in any timeframe. The fibonacci level 1.618 and 2.618 reached... coincidence?
.

Sunday, September 13, 2009

gbpusd

Last friday a doji was formed, as expected. So far the downtrend is beginning but I didn´t enter the trade. If we had a five-wave uptrend, we can expect a correction. If not a five-wave in downtrend, at least a three wave correction.


If we are in a downward five-wave impulse action, we are at the beginning of a wave three and anyone knows that this should be the one to be taken. In a closer look we can analyze the 4H chart. On friday we had the perfect entry opportunity with a spining top at morning. By now I would like to enter a trade... the question is when. With a trailing one bar entry Tr-1BL I should enter the trade at 1.6640 but now is too late with price around 1.6600. The stop should be around 1.6750


Should I enter now? Or I need to wait for a kind of Gann pullback. But hesitation hits me again. The old adage is never wrong... trend is your friend, you don´t need, want or be able to fight against it. We are in a strong uptrend. Why should I be going short? when the trend is bullish. Time will tell.

.

Thursday, September 10, 2009

GBPUSD sep10

The sHs pattern seems that was true, so, the cross went up from 1.6200 aprox to 1.6646 so that´s 446 pips in six days. I would like to be in the trade but I didn´t jump in.


What is happening now?... Not too clear to me but this is what I´m seeing...

We have completed a five-wave cycle labeled with green numbers. Blue ABC waves represent a possible reverse pattern, then, a first leg in a new downtrend.

I´ve drawn fibonacci levels and seems to me that wave two could be reaching the 38.2 level. Stochastics are overbought and seems a possible cross to the downside. Remember that round numbers are resistances too! so 1.6700 will be something to take care about it. Tomorrow the markets will give more clues about it. If we see a doji, that could be a confirmation of an exhaustion of bullish traders.

The alternative scenario would be a bullish candle breaking the 38.2 level. The next resistance level would be 23.6 and if the price breaks it too, the downtrend have to be dismissed and price would go beyond 1,7040 (august 5th high).

.

Sunday, September 6, 2009

gbpusd review

A lot of time has pass, and market flow with grace...

Let's review what happened since last gbpusd update. My target around 1.5325/1.5352 was nicely reached one day after my prediction at may 12th, but... that time I stated that should be taken as a short trigger. How wrong I was...


I have labeled with green numbers the major elliot wave count. We can see that this was the wave three and it's always the longest one. In may 12th we were at the middle, nevertheless, we can appreciate the congestion (or consolidation?) between those days, just for watch market break that resistance level and go higher and higher.

With blue numbers I've labeled a minor elliot wave count. We can see that wave three
reached 2.618 fibonacci level... coincidence? don't think so.

What's happening now? I can appreciate a SHS formation there. What should do? I think that we may go long but we never know for sure.

Things that I have to work with... entry strategies.

.

Friday, September 4, 2009

Back to the known

Too many things have distracted me in this last few weeks/months... If I want to make this right, I have to be more serious about it.

Never is too late and hope is the last thing to extinguish, but do not confuse hope with knowledge. I´m not talking about markets. There is not such thing as hope there.

Studying charts... my only distraction from now... what timeframe should ask yourself... I don´t know. I do know that any timeframe reacts almost equally to technical analysis. I would like to start to trade again. A larger timeframe requires a bigger stoploss so if everythings goes against me, 2% per operation shouldn´t be enough, so a minor timeframe more than likely would be a possibility.

Tomorrow an update about what happened with my gbpusd analysis from way back.

.